Public Sector Data
Building a Data Layer for Sewer Monitoring: My WASA Lahore Experience
How a voluntary data and analytics project on Lahore's sewer network taught me that the layer between an AI model and a decision is where the real value lives.
When people hear the word AI today, they usually think of chatbots, copilots and generative tools. In 2022 and 2023, AI in infrastructure looked very different.
It was cameras, sensors, inspection images, SQL databases, operational records and dashboards. It was not about asking a model to write something. It was about taking information out of messy public-sector systems and turning it into something engineers could trust.
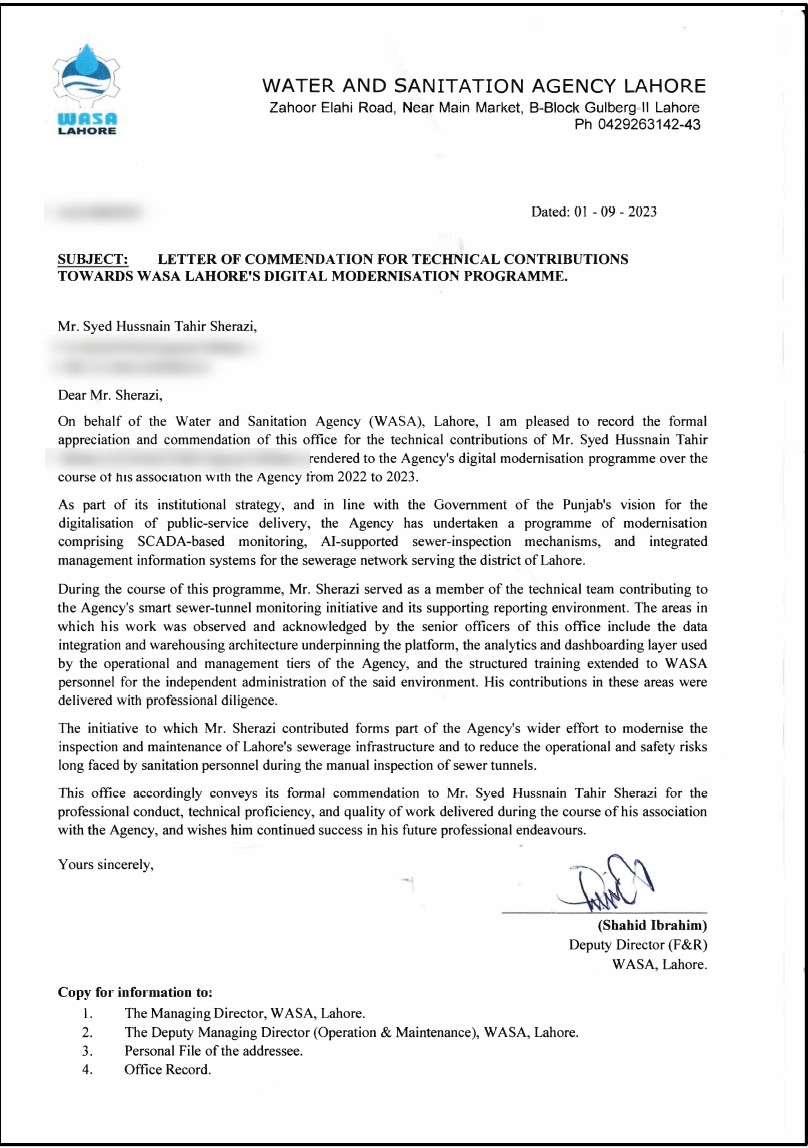
That is the context for my voluntary contribution to WASA Lahore's sewer-monitoring modernisation work. I did this in evenings and weekends while my main job was UX research at Transsion. That background mattered. I cared less about how a dashboard looked and more about whether an engineer could make a decision from it.
The problem was not the dashboard
A city-scale sewerage system produces many types of information, and most of it does not naturally sit in one clean place. Inspection outputs may sit in one stream. Operational records may sit in another. Asset locations, zones, defect categories and maintenance history may not be connected clearly enough for decisions to be made from them.
A sewer defect is not useful as data just because it exists in a system.
It becomes useful when it is tied to location, severity, asset type, zone, inspection context and maintenance action. A camera can capture a crack or a blockage. A model can flag a defect. But that output only becomes valuable when a maintenance team can filter it, group it, trust it and act on it.
Closing that gap was the part I worked on.
Why sewer inspection was hard to scale
Sewer networks are difficult to monitor. They are underground, spread across large urban areas and often depend on manual inspection, field reporting and reactive maintenance. By 2022, the research direction was clear: computer vision had strong potential for sewer inspection, but the field was still young, especially around open datasets, rare defects and model uncertainty.
One important reference point was Sewer-ML, a public sewer-defect dataset released before my WASA work. It contained more than a million annotated sewer-inspection images and gave researchers a benchmark for defect classification. That mattered because sewer AI was not yet a mature plug-and-play field. The sector was still building the foundations: open datasets, consistent defect labels, benchmark models and evaluation methods.
There was also a growing concern around trust. In 2022, researchers were already warning that sewer-defect models could become overconfident. They might perform reasonably well on known defect categories, but fail when rare or unfamiliar defects appeared. In infrastructure, that matters. A missed severe defect is not just a model error. It can become an operational risk.
So I do not describe this as AI solving sewer inspection. That would be too simple.
A more accurate description is this: WASA was moving toward digital sewer and drainage monitoring, and my role was to help build the data engineering and analytics layer that turned inspection and operational outputs into usable maintenance intelligence.
What I built
My work sat between the raw operational systems and the people making decisions.
The wider programme involved several streams, including camera-based sewer inspection, SCADA monitoring, GIS mapping, complaint management and operational dashboards. My part was the data and reporting layer. I worked mainly with camera-derived inspection outputs and legacy operational records, then shaped that data into a structure that could support engineering and maintenance reporting.
The stack was practical and on-premise:
- SQL Server and SSMS for the core data layer
- ETL processes to clean and organise operational records
- ODBC reporting views over the structured data
- Power BI dashboards built on top of those views
The point was never the visuals. It was the reporting structure underneath them, and the analysis that structure made possible.
Turning inspection data into analytics
A pile of inspection records is just rows until someone analyses it. That analysis was the real value of the layer.
The work was descriptive and diagnostic analytics. Counting defects by type. Grouping them by zone. Ranking them by severity. Looking for recurrence over time. The reporting layer had to answer practical questions. Which zones showed repeated defects? Which issues looked severe enough to come first? Were blockages, cracks, leaks, corrosion or root intrusion appearing in patterns? Where did engineers need a summary view, and where did analysts need record-level detail?
That is the difference between a dashboard and a data product. A dashboard is quick to build. A data product needs a stable model behind it, consistent definitions and users who trust that a number means the same thing across every report.
My UX research background fed straight into this. Before deciding what a report should show, I looked at how engineers and managers actually made maintenance decisions, what they asked first and what they ignored. The analytics were built around those decisions, not around what was easy to chart. Managers got a summary view. Analysts got record-level detail. Severity and zone sat at the front, because that is what drove the next action.
Open-data discipline, even when the data is internal
The WASA data itself was operational. It could not simply be published like an open dataset. But the work still needed open-data discipline.
For me, that meant thinking carefully about definitions, categories, traceability and repeatability.
If one report showed a defect count, another report should not contradict it because of a different join or hidden filter. If a severity category was used, it needed to mean the same thing across the reporting layer. If a zone was selected, the dashboard needed to respond in a predictable way. If a defect was grouped as a blockage, leak, crack, corrosion or root intrusion, the logic behind that grouping needed to be clear enough for someone else to understand later.
Open data is not only about publishing files publicly. It is also a way of thinking: clear structure, understandable fields, consistent categories, repeatable flows and explainable metrics. Even when the data stays internal, that discipline makes the system easier to maintain after the original builder has moved on.
From reactive to preventive maintenance
Infrastructure maintenance can easily become reactive.
A problem appears. A complaint is raised. A team investigates. A repair is planned.
Sewer networks do better when the organisation can move earlier. If defect patterns are visible before failure, maintenance can be planned instead of only reacting to complaints or emergencies.
That was the thinking behind the reporting views I built to support preventive maintenance. Defects such as cracks, blockages, leaks, corrosion and root intrusion were organised by zone and severity, so the reporting layer supported prioritisation instead of only recording history.
It did not replace engineers, and it did not forecast failures with a model. It gave teams a better operating picture. A single defect may say little on its own. But repeated issues in the same zone, high-severity defects in critical locations, or recurring patterns across inspection records can help teams decide where to look first.
That is where analytics becomes useful in public infrastructure.
Building on legacy systems
The environment was legacy, which is the realistic part of the job.
Public-sector organisations rarely start with a clean modern platform. They have old databases, spreadsheets, manual processes and teams already under pressure. You cannot replace everything overnight, so you build on top of what exists.
By defining reporting logic closer to the data model, through SQL and ODBC views, the dashboards became less dependent on manual spreadsheet work and less fragile than reports where each visual carries its own separate logic. The same definitions could feed multiple views instead of being recreated again and again inside individual charts. That kind of work is not always visible to an end user, but it is what makes a dashboard trustworthy.
The human reason behind the work
Sewer monitoring is also a safety issue.
Manual sewer inspection can expose workers to confined spaces, poisonous gases and dangerous operating conditions. Camera-based inspection and digital monitoring can reduce how often people have to enter those spaces unnecessarily.
To be clear about scope, the camera hardware, robotic inspection and computer-vision model were the project team's work, not mine. My part was the data and analytics layer that helped turn those outputs into operational information. But without that layer, the technology is much harder for maintenance teams to actually use.
AI does not create impact simply by producing an output. It creates impact when that output is structured, checked, connected to operations and delivered to people who can act on it.
What I learned
This project shaped how I think about data engineering and analytics.
Public-sector data work is not about chasing the newest tool. It is about making fragmented systems usable. A dashboard is only as strong as the model behind it. And AI in infrastructure needs a human in the loop, because engineers still have to understand and trust what they are seeing.
The timing also matters. This was a 2022 and 2023 project. It was not generative AI, not agentic AI and not today's overhyped version of automation. It was classical computer vision, CCTV inspection, defect detection, uncertainty, SQL, reporting models and operational analytics.
The value was never in pretending that AI could make the final call. The value was in structuring and analysing the data so that camera-derived and AI-assisted observations could be reviewed, grouped and acted on earlier, with more context.
I work in data engineering for a UK public authority now, and the problems rhyme. Old systems. Real operational data. Manual processes. Teams that need reporting they can trust. A constant need to turn messy information into something people can act on.
WASA is where I learned that the layer in the middle is often where most of the value lives.
Want to know more?
Curious about the data layer, the reporting model, or how this would apply to your own public-sector or operational data? I am happy to talk it through. Ask me anything.
Ask me a question